Finding the right color has never been easier#
PyPalettes is a new Python library designed to simplify the use of color palettes in Python charts.
It provides mainly two things:
- a super-easy-to-use library that requires only 1 line of code (in 99.99% of cases, 2 otherwise 🙃) to access thousands of pre-defined and attractive palettes.
- a web app to browse, filter, search, and preview all available palettes (with bonus: copy-pastable code to reproduce the charts).

From R to Python#
In R, there are dozens of packages dedicated to colors for data visualization. Then Paletteer came out to aggregate every color palette from those packages into a single one, meaning you only need one package to access almost all the color palettes people have created!
While re-crafting the colors section of the Python Graph Gallery, I started thinking of a way to have a similar tool to Paletteer but for Python.
That's where PyPalettes comes in.
Paletteer has a community-maintained gallery—a single page showcasing all its color palettes, along with their original sources and names. With the author’s approval, I scraped this gallery to compile the data.
While there may have been other ways to obtain this information, using a short Python script to reproduce the dataset ensures both simplicity and reproducibility (the script scrapes a page stored locally instead of the web page). To make pypalettes more comprehensive, I also incorporated all built-in colors from Matplotlib.
As a result, I created a dataset containing approximately 2,500 unique palettes, each with a name, a list of hexadecimal colors, and a source.
At this point, the hardest part was already done. I just had to create a simple API to make them usable in a Python environment and add some additional simple features.
And since Yan supported the idea, he created this amazing web app, making it much easier to browse available palettes.
As a thank-you to Paletteer, Yan also created a color finder that features only Paletteer palettes! If you use R, check it out here.
How to use pypalettes#
The goal was to make the simplest API possible, and I’m quite satisfied with the result. For example, you really like the “Esox lucius” palette, and you want to make a chart with it.
First, you import the load_cmap() function (the main function of the library):
from pypalettes import load_cmapAnd then you just have to call this function with name="Esox_lucius"
cmap = load_cmap("Esox_lucius")The output of load_cmap() is either a matplotlib.colors.ListedColormap or a matplotlib.colors.LinearSegmentedColormap, depending on the value of the cmap_type argument (default is "discrete", so it’s ListedColormap in this case).
Finally, you can create your chart as you normally would:
# load libraries
import cartopy.crs as ccrs
import geopandas as gpd
import matplotlib.pyplot as plt
from matplotlib.font_manager import FontProperties
from highlight_text import fig_text

# load font
personal_path = "/Users/josephbarbier/Library/Fonts/"  # change this to your own path
font = FontProperties(fname=personal_path + "FiraSans-Light.ttf")
bold_font = FontProperties(fname=personal_path + "FiraSans-Medium.ttf")

# projection
proj = ccrs.Mercator()

# load the world dataset
df = gpd.read_file(
    "https://raw.githubusercontent.com/holtzy/The-Python-Graph-Gallery/master/static/data/all_world.geojson"
)
df = df[~df["name"].isin(["Antarctica"])]
df = df.to_crs(proj.proj4_init)

fig, ax = plt.subplots(figsize=(12, 8), dpi=300, subplot_kw={"projection": proj})
ax.set_axis_off()
df.plot(
    column="name",
    ax=ax,
    cmap=cmap,  # here we pass the colormap loaded before
    edgecolor="black",
    linewidth=0.2,
)
fig_text(
    x=0.5,
    y=0.93,
    s="World map with <PyPalettes> colors",
    fontsize=25,
    ha="center",
    font=font,
    highlight_textprops=[{"font": bold_font}],
)
fig_text(
    x=0.85, y=0.14, s="Joseph Barbier & Yan Holtz", fontsize=8, ha="right", font=font
)

plt.show()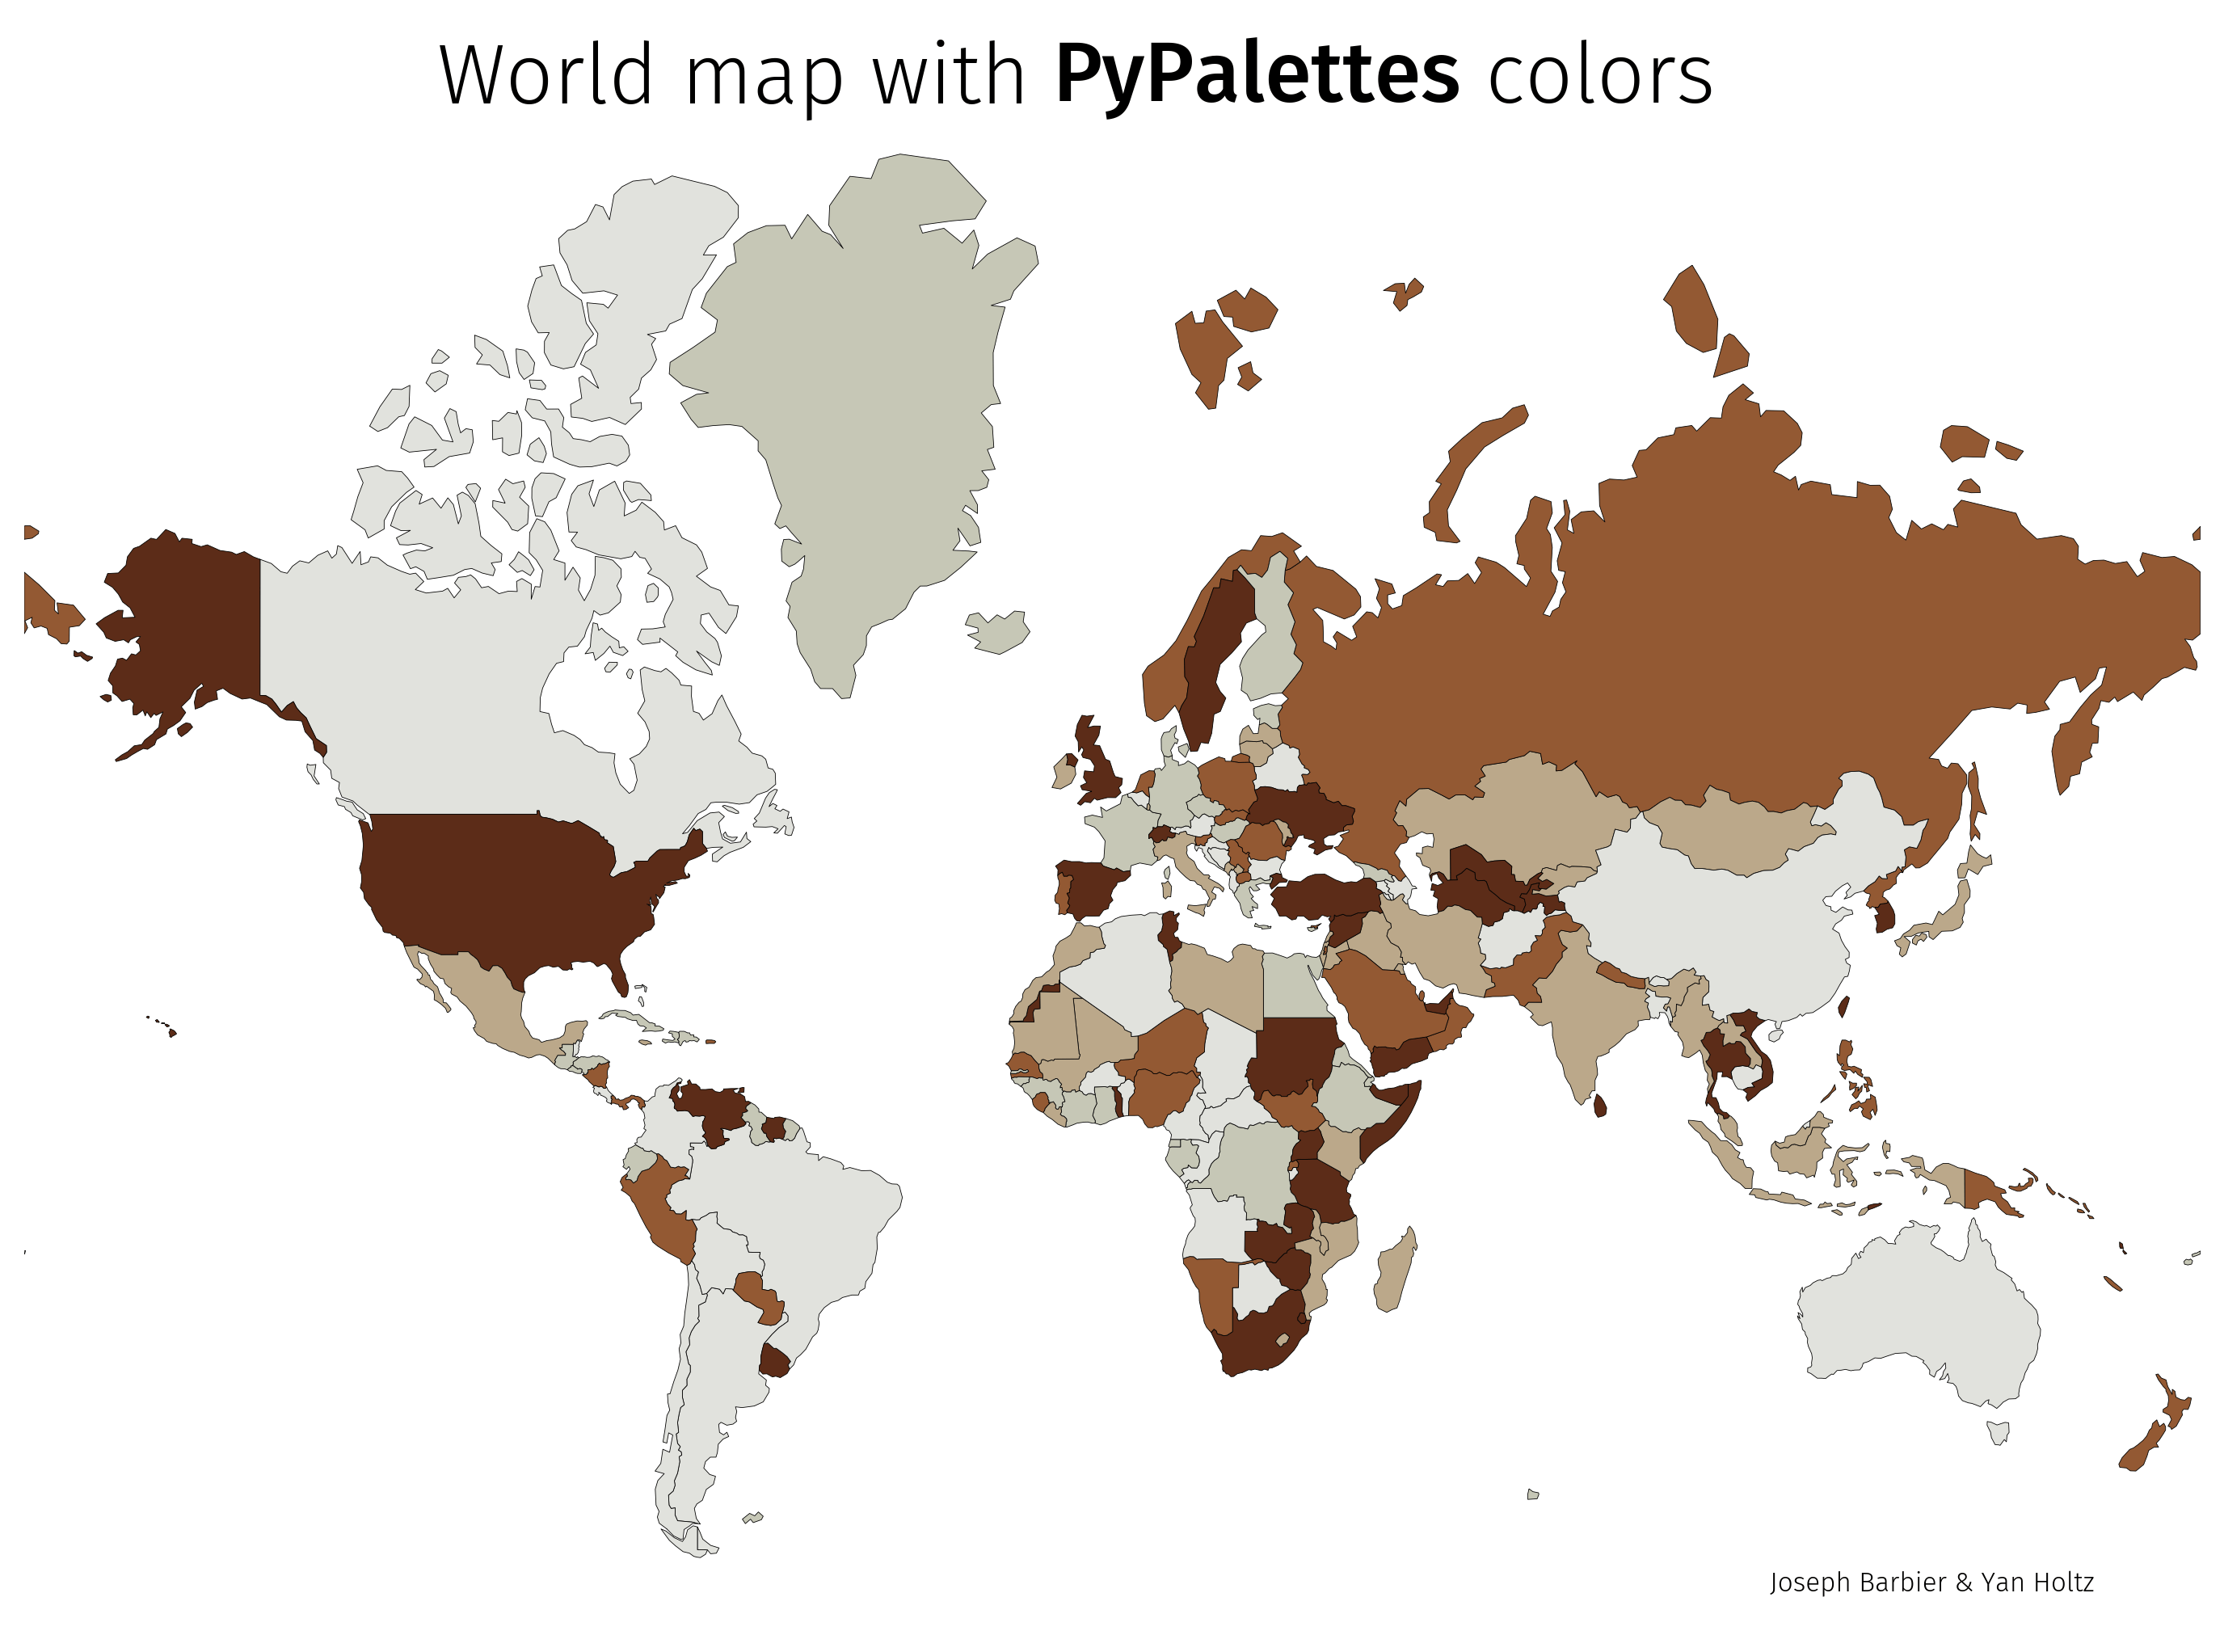
And once the code is working, you can change the color map name and see straight away what it would look like!
Other usages#
PyPalettes is primarily designed for matplotlib due to its high compatibility with the cmap argument, but one can imagine much more.
For example, the output of load_cmap() includes attributes like colors and rgb, which return lists of hexadecimal colors or RGB values. These can be used in any context—from Python visualization libraries like Plotly, Plotnine, and Altair to colorimetry, image processing, or any application that requires color!
Learn more#
The main links to find out more about this project are as follows:
- the web app to browse the palettes
- this introduction to PyPalettes for a more in-depth code explanation
- the Github repo with source code and palettes (give us a star! ⭐)